
Revenue Operations Field Guide
Revenue Operations Metrics: The KPIs, Formulas, and Decisions That Matter
Revenue Operations metrics measure how effectively a company attracts suitable customers, helps them reach value, converts demand into revenue, retains and expands relationships, and produces attractive economics.
The hard part is not finding another KPI. It is choosing a small set of measures that share precise definitions and lead to better decisions across Product & Engineering, Marketing, Sales, Customer Success, and Finance.
This guide goes deeper than the measurement overview in our complete guide to Revenue Operations. It includes practical formulas, interpretation guidance, and a model for building a useful RevOps dashboard.
How to choose Revenue Operations metrics
A compact operating scorecard
Start with the decision, then expand the diagnostic detail only where it helps. These are example measures, not universal targets.
| Metric | Formula or definition | Decision |
|---|---|---|
| Activation rate | Activated eligible accounts ÷ eligible starting accounts × 100 | Is acquisition fit or onboarding limiting early value? |
| Opportunity win rate | Wins ÷ closed wins and losses × 100 | Is qualification or execution changing? |
| Forecast error | Absolute forecast error ÷ actual × 100 | Is the forecast reliable at a fixed capture date? |
| GRR | Starting recurring revenue less churn and contraction, divided by starting revenue × 100 | How much existing revenue is preserved before expansion? |
| NRR | Starting recurring revenue plus expansion, less churn and contraction, divided by starting revenue × 100 | Does the existing customer base grow? |
| CAC payback | CAC ÷ monthly gross profit per new customer | How long does it take to recover acquisition investment? |
Keep the population, period, source, and accountable owner beside each number. A percentage without its underlying count can conceal a small or changing sample.
Start with the decision the business needs to make.
If the decision is whether to increase acquisition spending, raw lead volume is insufficient. Leaders need to understand downstream activation, conversion, retention, gross profit, and the time required to recover acquisition cost.
If the decision is whether Sales should engage a product-qualified account, a high feature count is insufficient. The business needs evidence of fit, meaningful behavior, account identity, customer context, and the outcomes of previous interventions.
Use five tests before promoting a number to a core KPI:
- Decision: What decision could this metric change?
- Definition: Can two informed people calculate the same result independently?
- Behavior: Could the metric reward activity that harms the customer or business?
- Timing: Has enough time passed for the outcome to be observed?
- Ownership: Who investigates the change and can influence the result?
The minimum complete metric definition
Every recurring KPI should specify:
- Name: A stable, unambiguous label.
- Entity: Person, account, workspace, opportunity, subscription, location, project, or another unit.
- Population: Who or what is eligible.
- Numerator: The qualifying outcome.
- Denominator: The starting or eligible group.
- Window: The period in which the outcome must occur.
- Date basis: Cohort-start date, event date, close date, invoice date, or another timestamp.
- Source: Authoritative system and fields.
- Exclusions: Test accounts, duplicates, internal users, reversals, or other cases.
- Owner: Person responsible for definition and monitoring.
- Decision: How the result will be used.
“Trial-to-paid conversion” becomes useful only when the company defines whether the unit is a user or account, which trials qualify, how extensions and reactivations are treated, and how long a trial has to convert.
The Revenue Operations metric tree
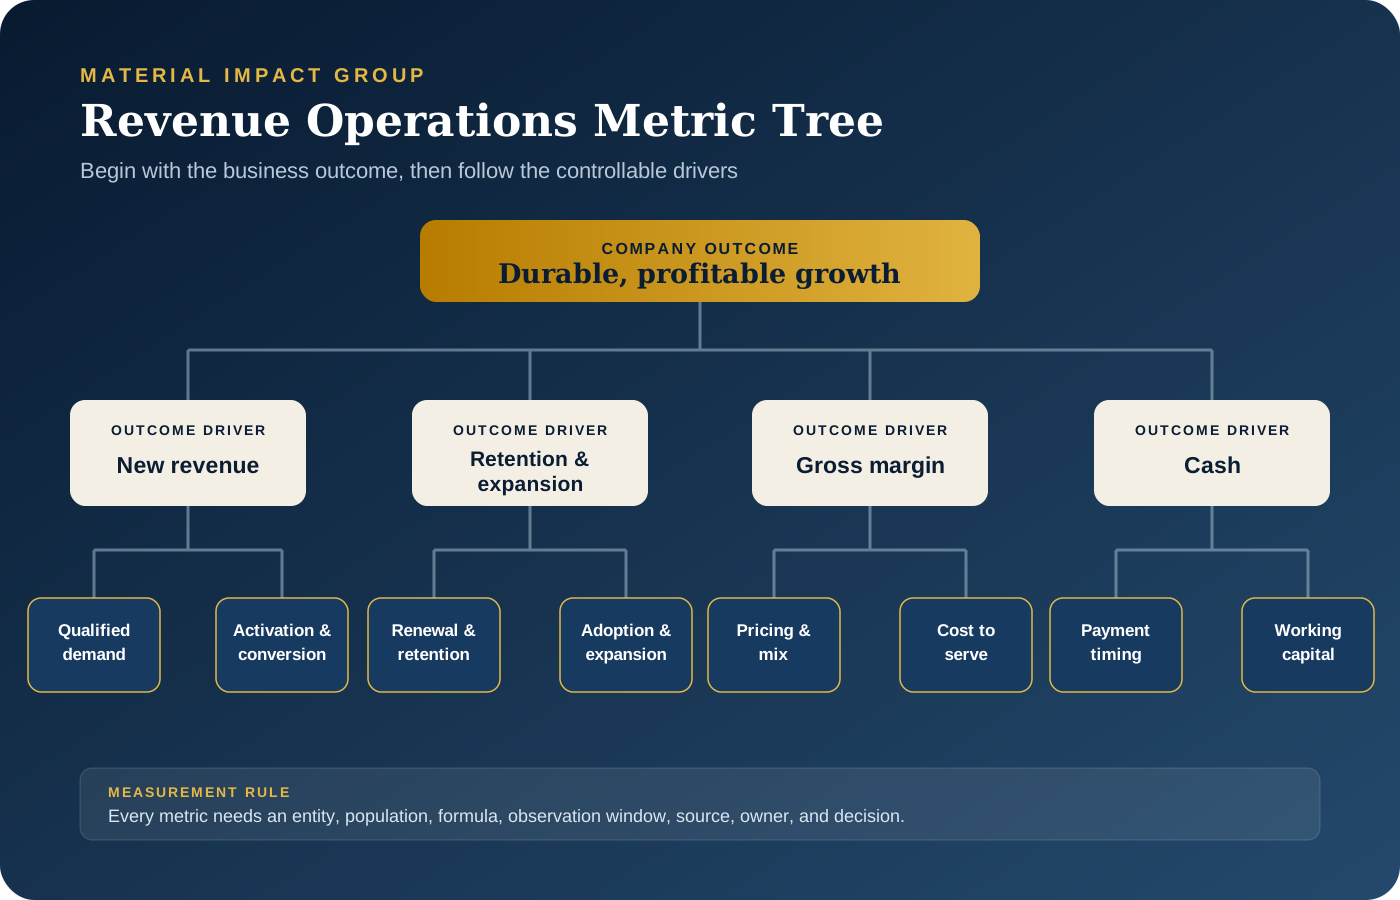
A metric tree connects a company-level outcome with the controllable drivers beneath it.
For a recurring-revenue business, one simplified structure is:
Recurring revenue growth
- New recurring revenue
- Qualified demand or suitable product signups
- Activation
- Conversion or win rate
- Average initial contract value
- Existing-customer recurring revenue
- Starting recurring revenue
- Renewal or retention
- Contraction
- Expansion
- Revenue quality and economics
- Gross margin
- Acquisition and delivery cost
- Payment and cash timing
This structure is diagnostic, not a universal accounting formula. It helps the team move from “revenue missed plan” to a more specific explanation.
Leading, intermediate, and lagging indicators
- Leading indicators occur early enough to influence an outcome: qualified demand, activation, meaningful adoption, verified buyer milestones.
- Intermediate indicators show progression: opportunity creation, onboarding completion, product-qualified accounts, renewal readiness.
- Lagging indicators confirm the financial result: recognized revenue, gross profit, churn, net revenue retention, cash collection.
A useful operating dashboard includes all three. Leading indicators without financial outcomes can create false confidence. Lagging indicators alone arrive too late to guide action.
Acquisition metrics
Acquisition measurement should connect demand generation with customer quality and downstream economics.
Qualified demand rate
Formula:
Qualified people or accounts ÷ eligible captured people or accounts × 100
Define qualification using observable fit and need. Do not allow the definition to change silently when a volume target is missed.
Use it to decide: Whether targeting, positioning, channel mix, or qualification rules need attention.
Watch for: Counting people in an account and accounts in the same denominator; using form completion as proof of buyer readiness.
Source-to-activation rate
Formula:
New customers or accounts from a source that activate within the window ÷ eligible new customers or accounts from that source × 100
This connects acquisition source with early value rather than a shallow conversion.
Use it to decide: Which channels attract customers the product or service can serve well.
Watch for: Different observation windows across recent and older cohorts.
Customer acquisition cost (CAC)
Basic formula:
Defined acquisition costs ÷ new customers acquired
The formula is easy; the cost boundary is not. Decide whether CAC includes paid media, agencies, Marketing salaries, Sales salaries and commissions, tools, events, partner fees, onboarding incentives, and shared overhead.
Use it to decide: How efficiently a motion or segment creates new customers.
Watch for: Comparing definitions that include different costs; dividing current spending by customers whose acquisition effort occurred in another period.
Blended vs. segmented CAC
Blended CAC can hide meaningful differences among self-service, sales-assisted, partner, enterprise, and SMB motions.
Report both:
- Blended CAC for an overall company view.
- Segmented CAC for operating and investment decisions.
Cost per qualified opportunity or account
Formula:
Defined acquisition costs ÷ qualified opportunities or accounts created
This intermediate metric is useful when revenue outcomes take a long time to mature, but it should eventually be reconciled with wins, retention, gross profit, and cash.
Activation and adoption metrics
Activation and adoption show whether the customer is reaching and repeating meaningful value. They are especially important in product-led and hybrid motions.
Activation rate
Formula:
Eligible new users or accounts reaching the activation milestone within the window ÷ eligible starting cohort × 100
An activation milestone should represent an early experience of value, not simply account creation, login, or setup activity.
Example: A collaborative analytics product might define account activation as connecting a valid data source, publishing a first shared dashboard, and having a second user view it within 14 days.
Use it to decide: Whether acquisition fit, onboarding, implementation, education, reliability, or the product experience needs attention.
Watch for: Choosing a milestone because it is easy to track rather than because it predicts or represents value.
Time to first value
Formula:
Timestamp of value milestone − defined starting timestamp
Report the median and a distribution—not only the average. Include the percentage of the cohort that never reaches the milestone.
Use it to decide: Where the company can reduce avoidable delay in onboarding or implementation.
Watch for: Excluding unsuccessful customers, which makes the result look artificially strong.
Adoption rate
General formula:
Eligible customers demonstrating the defined recurring value behavior within the period ÷ eligible active customers × 100
The behavior may combine:
- frequency;
- depth of important workflow use;
- breadth across relevant capabilities;
- number or percentage of intended users;
- quality or successful completion; and
- persistence across several periods.
Use it to decide: Whether customers are developing durable value and which obstacles deserve intervention.
Watch for: Treating high raw activity as healthy when the product is automated, seasonal, or used intensively by only one necessary role.
Breadth of adoption
Possible formula:
Active intended users in an account ÷ eligible intended users in the account × 100
This is useful when customer value increases through team or organizational adoption.
Watch for: Using purchased seats as the denominator when the actual eligible population is unknown or materially different.
Product-qualified lead or account conversion
Formula:
PQLs or PQAs achieving the defined outcome within the window ÷ eligible PQLs or PQAs × 100
A PQL is a person whose fit and product behavior meet defined qualification criteria. A PQA applies qualification at the account level, potentially combining signals across users.
Use it to decide: Whether the qualification model identifies customers for whom a specific next action is useful.
Watch for: Designing the rule on historical outcomes and judging it on the same data; treating product usage as proof of purchase intent.
For a deeper operating model, see RevOps for product-led growth.
Conversion, pipeline, and forecast metrics
These metrics show how demand becomes committed revenue and how reliably the company understands that process.
Stage conversion rate
Formula:
Entities entering the next defined stage ÷ eligible entities entering the current stage × 100
Use cohorts when possible. A snapshot of the current funnel can mix new records with old stalled records and hide the time required to progress.
Use it to decide: Where progression changes materially and which stage warrants record-level inspection.
Watch for: Deleting or excluding disqualified records in a way that inflates conversion.
Opportunity win rate
Count-based formula:
Won opportunities ÷ (won opportunities + lost opportunities) × 100
Value-based formula:
Value of won opportunities ÷ value of won and lost opportunities × 100
Report both when deal sizes vary meaningfully. Define how no-decision, duplicate, cancelled, and merged opportunities are handled.
Use it to decide: Whether opportunity quality, sales execution, product fit, pricing, competition, or decision process has changed.
Watch for: Opening opportunities later to improve the reported win rate; excluding no-decision outcomes inconsistently.
Sales cycle length
Formula:
Close-won timestamp − defined opportunity-start timestamp
Report median and percentile ranges by segment, motion, and deal size.
Use it to decide: Where evaluation, security, legal, procurement, implementation planning, or internal process creates delay.
Watch for: Using opportunity-created date when teams create opportunities at materially different stages.
Pipeline coverage
Formula:
Eligible open pipeline for the period ÷ remaining revenue target for the period
Coverage is meaningful only when paired with historical conversion, stage quality, remaining time, and pipeline composition. A single universal “3×” or “4×” target is not appropriate for every business.
Use it to decide: Whether the company has sufficient qualified opportunity value and where risk is concentrated.
Watch for: Including pipeline with unrealistic close dates, weak evidence, or duplicate potential.
Pipeline velocity
One common diagnostic formula is:
Number of qualified opportunities × average deal value × win rate ÷ average sales-cycle days
This creates a directional estimate of value moving through the pipeline per day. It is not recognized revenue or a forecast.
Use it to decide: Which combination of opportunity volume, value, conversion, or speed creates the greatest constraint.
Watch for: Multiplying averages from very different segments into a result that describes none of them.
Forecast error
Absolute percentage error:
|Forecast − actual| ÷ actual × 100
Use a fixed forecast capture date. Report the raw error and direction:
- Over-forecast: Forecast exceeded actual.
- Under-forecast: Actual exceeded forecast.
Percentage error is undefined when actual is zero. Use an absolute currency error or another documented method in that case.
Use it to decide: Whether forecast definitions, evidence, judgment, timing, or model assumptions need improvement.
Watch for: Measuring only the final forecast shortly before close; changing the historical forecast after the fact.
Forecast bias
Formula:
Sum of (forecast − actual) ÷ number of observations
Persistent positive or negative bias can be hidden by average absolute error.
Close-date push rate
Formula:
Open opportunities moved out of the original period ÷ opportunities expected to close in the original period × 100
Use it to decide: Whether buyer milestones, close-date discipline, or deal inspection needs attention.
Watch for: Resetting the “original” close date when the date changes.
Retention and expansion metrics
Retention metrics should begin with a fixed existing-customer cohort and exclude new customers from the period.
Logo or customer retention rate
Formula:
Customers at period start that remain at period end ÷ eligible customers at period start × 100
Use it to decide: How broadly churn affects the customer base.
Watch for: Treating a very small and a very large customer as economically equivalent when interpreting the result.
Gross revenue retention (GRR)
Formula:
(Starting recurring revenue − churn − contraction) ÷ starting recurring revenue × 100
GRR excludes expansion and new customers. It cannot exceed 100% under the standard definition.
Use it to decide: How much existing revenue the business preserves before expansion.
Watch for: Netting expansion against churn, which turns the measure into something other than GRR.
Net revenue retention (NRR)
Formula:
(Starting recurring revenue − churn − contraction + expansion) ÷ starting recurring revenue × 100
NRR may exceed 100% when expansion is greater than churn and contraction.
Use it to decide: Whether the existing customer base grows or shrinks after all recurring-revenue movement.
Watch for: Adding new-customer revenue; changing currencies or revenue bases without documentation.
Renewal rate
Count-based formula:
Renewed contracts ÷ eligible contracts due for renewal × 100
Value-based formula:
Renewed eligible contract value ÷ eligible contract value due for renewal × 100
Define early renewals, automatic renewals, month-to-month customers, and multi-year agreements.
Expansion rate
Formula:
Expansion recurring revenue from the starting cohort ÷ starting recurring revenue × 100
Break expansion into drivers such as seat growth, usage, cross-sell, upgrades, locations, or price changes.
Churn and contraction reason coverage
Formula:
Churned or contracted value with a usable standardized reason ÷ total churned or contracted value × 100
Coverage is a data-quality metric, not a business outcome. The categories should distinguish root evidence from the final commercial event. “Budget” may describe the decision without explaining why the product was not valuable enough to protect.
Revenue economics metrics
Revenue growth is not the same as profitable growth. RevOps should connect lifecycle performance with Finance-approved economics.
Gross margin
Formula:
(Revenue − cost of revenue) ÷ revenue × 100
Use Finance's authoritative revenue and cost classifications. Segment-level gross margin may require allocation rules.
Use it to decide: Whether pricing, delivery cost, infrastructure, support, service mix, or customer mix needs attention.
CAC payback period
One simplified formula is:
CAC ÷ average monthly gross profit from a new customer
For a subscription business, monthly gross profit may be approximated using average monthly recurring revenue multiplied by gross-margin percentage, but the business should document the exact method.
Use it to decide: How long acquisition investment remains unrecovered.
Watch for: Using revenue instead of gross profit; ignoring ramp, churn, implementation cost, or cash timing.
Lifetime value (LTV)
LTV methods vary significantly. A simple steady-state estimate may use:
Monthly revenue per customer × gross-margin fraction ÷ monthly customer churn rate
Use customer (logo) churn, not net revenue churn, in this simplified formula. Match the monthly revenue and monthly churn periods and enter percentages as fractions. For example, $100 monthly revenue × 0.80 gross margin ÷ 0.02 monthly customer churn = $4,000 estimated lifetime gross profit. This is an illustrative steady-state estimate, not a forecast or a measure of cash collected.
The estimate requires positive churn and assumes stable revenue, margin, and customer churn. It becomes unreliable for young cohorts, changing customer mix, contractual renewal patterns, or substantial expansion. ChartMogul's explanation of the basic LTV formula uses customer churn and describes the limitations of simplified estimates.
Prefer a cohort-based model when enough data exists:
Present value of expected customer gross profit − present value of customer-specific costs not already included in gross profit
Use it to decide: How customer quality and retention economics influence acquisition investment.
Watch for: Presenting a speculative LTV/CAC ratio as precise.
Contribution margin
General formula:
Contribution profit = Revenue − defined variable costs attributable to that revenue
Contribution margin (%) = Contribution profit ÷ revenue × 100
Finance should define which costs are included. This can reveal segments that appear attractive at gross margin but require unusually high sales, onboarding, or support effort.
Revenue per employee or revenue per revenue-team employee
Formula:
Revenue for the period ÷ average relevant headcount during the period
This is a broad productivity indicator, not a target to maximize in isolation. It can improve because the business became more efficient—or because it underinvested in service, product, or future growth.
How to build a RevOps dashboard
A useful dashboard is a decision interface, not a warehouse of charts.
Executive Revenue Operations scorecard
Keep the executive view to the measures that explain the plan and its principal risks. A recurring-revenue example might include:
- New recurring revenue vs. plan
- Expansion, contraction, and churn
- GRR and NRR by cohort or segment
- Qualified pipeline and coverage
- Forecast, actual, error, and bias
- Activation and time to first value
- Acquisition efficiency and gross margin
- One or two operating constraints currently under intervention
Functional operating views
Functional teams need more diagnostic detail:
- Marketing: source, fit, qualification, downstream activation and revenue.
- Sales: opportunity evidence, conversion, cycle, pipeline changes, forecast risk.
- Product & Engineering: activation, adoption, friction, reliability, account impact.
- Customer Success: objectives, adoption, risk, renewal, expansion, support and outcome evidence.
- Finance: plan, bookings, billing, recognized revenue, margin, cash and authoritative actuals.
All views should reconcile to shared definitions where they overlap.
Cohorts before snapshots
A snapshot answers “what is open now?” A cohort answers “what happened to the group that began at the same point?”
Use snapshots for workload and current-state management. Use cohorts for conversion, activation, retention, and causal investigation.
Segment before average
Overall averages can hide opposing movements. At minimum, inspect important metrics by:
- customer segment;
- revenue motion;
- product or package;
- acquisition source;
- geography where relevant;
- new vs. existing customer; and
- self-service vs. assisted experience.
Do not segment so deeply that sample sizes become meaningless or privacy is compromised.
Pair the metric with a review cadence
| Cadence | Typical decisions |
|---|---|
| Daily or near-real-time | Routing failures, system errors, response exceptions, acute service risk |
| Weekly | Pipeline movement, experiments, onboarding constraints, adoption of new workflows |
| Monthly | Cohort performance, forecast accuracy, acquisition quality, churn and expansion patterns |
| Quarterly | Capacity, segment economics, pricing, territory, tech stack, roadmap and operating priorities |
The cadence should reflect how quickly the underlying process changes and how soon action remains useful.
Common RevOps measurement mistakes
- Counting users in one stage and accounts in another.
- Comparing immature recent cohorts with fully observed older cohorts.
- Changing metric definitions without versioning or restating history.
- Showing percentages without the underlying count or value.
- Optimizing a leading indicator that no longer predicts the outcome.
- Treating correlation between usage and retention as proof that increasing usage will cause retention.
- Giving every team its own version of shared revenue definitions.
- Using booked ARR, recognized revenue, invoices, cash, and contract value interchangeably.
- Measuring reclaimed time as though it were realized cash savings.
- Building dashboards before naming the decision and owner.
A practical metric dictionary template
Open the metric-definition worksheet → It includes a filled activation example and a blank definition you can reuse for each KPI.
| Field | Example entry |
|---|---|
| Metric name | 14-day account activation rate |
| Business purpose | Evaluate whether suitable new trial accounts reach first collaborative value |
| Entity | Account/workspace |
| Eligible cohort | New external trial accounts; excludes employees, tests, reactivations |
| Numerator | Eligible accounts meeting all three activation events within 14 days |
| Denominator | Eligible accounts with a trial start in the cohort period |
| Date basis | Trial-start date |
| Window | 14 complete days after trial start |
| Source | Product-event warehouse with account identity mapping |
| Owner | Product Analytics for event quality; RevOps for lifecycle definition |
| Segments | ICP fit, acquisition source, company size, assisted vs. self-service |
| Known limitations | Intended-user population not available for all accounts |
| Review cadence | Monthly cohort review |
| Decision | Prioritize onboarding and assistance experiments |
Frequently asked questions
What are the most important Revenue Operations metrics?
The answer depends on the business model and current constraint. Most B2B teams need a balanced view of acquisition quality, activation or early value, conversion and pipeline, forecast accuracy, retention and expansion, and revenue economics. The most important metric is the one tied to a consequential decision—not the longest standard KPI list.
How many KPIs should a RevOps dashboard contain?
An executive scorecard should usually contain only enough measures to explain performance and risk without becoming a diagnostic dump. Supporting operating views can contain more detail. If a metric does not change a decision, trigger investigation, or confirm an outcome, remove it from the recurring view.
What is the difference between a KPI and a diagnostic metric?
A KPI represents a critical outcome or driver that leadership monitors consistently. A diagnostic metric helps explain why it changed. Activation rate may be a KPI; error rate at a specific onboarding step may be a diagnostic measure.
Should RevOps own every revenue metric?
No. Finance owns accounting policy and authoritative financial actuals. Product or Engineering may own event quality. Marketing, Sales, and Customer Success own many operating inputs. RevOps should coordinate shared definitions, lineage, and use across the lifecycle.
How often should Revenue Operations metrics be reviewed?
Match cadence to decision speed. Operational exceptions may need daily attention. Pipeline and workflow adoption often need weekly review. Cohort, retention, forecast, and economics patterns may need monthly or quarterly review.
Build a measurement system people can trust
Material Impact Group helps leadership teams replace conflicting dashboards and activity-heavy scorecards with a small, coherent measurement system tied to customer progress and profitable growth.
That work can include metric definitions, lifecycle instrumentation, forecasting, cohort analysis, executive scorecards, Product & Engineering signals, and the operating reviews that turn evidence into action.